How EasyFit Is Used To Generate Smart Risk Discrete Analysis Models
Screenshots
EasyFit is a leading software application that simplifies complex mathematical calculations in the form of graphs, charts and tables. EasyFit makes it possible to quickly and easily choose the probability distribution that best suits your data, reducing your statistical analysis time by up to 70-95%. It comes with many powerful features designed to reduce your time, avoid unnecessary analysis, and aid you in making better choices for your data. It's easy to learn and employ - takes just a little basic knowledge of statistics, which you can master within a few days. You can run several trials on the software to check its compatibility with your software applications and also obtain a demo version before going ahead with the full purchase.The key feature of EasyFit is its automatic generation of optimal sample distributions that are based on your selected parameters. It automatically fits the normal curve by taking the arithmetic mean of the original data set, taking care to include all numbers that are significant in the model as well as the null distribution. This is important because the key feature of the EasyFit is to provide an easy way to choose the optimal sample distributions.
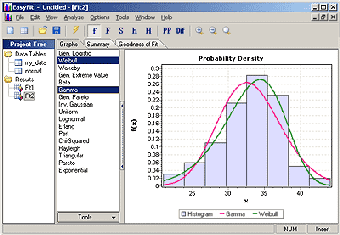
The EasyFit also provides a range of features and options to assist you in evaluating both historical data and recent trends and analysis results. EasyFit includes various plots, histograms and tables to provide you with a visual picture of the optimal sample distributions along with the range of significance that best explains the range of the normal curves that it generates. You can even compare the predicted value with the actual value to identify the best model for your data.


