Windows debugger
Screenshots
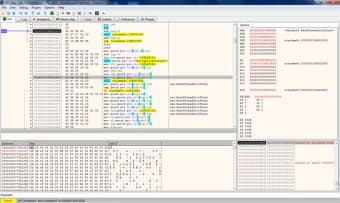
x64dbg is an open-source debugger compatible with 32- and 64-bit versions of Windows. You can download source files and tweak them to your liking, or try out an existing version.
Multiple debugging features
Debuggers are used to identify problems with computer software and hardware. Windows has a built-in debugger. If you’re more technically-minded x64dbg could be the right tool for you.
Open-source
If a programme is open-source, then it means the original code is available for free for anyone to manipulate. x64dbg is open-source. Alternatively, if you know what you’re doing, you can dive right into the guts of the programme and see what it can do.
Feature-rich
The key to any good debugger, whether it’s x64dbg or an alternative like ollydbg or windbg, is its features. x64dbg has plenty of options for dedicated coders, including C-like expression parser, register highlighter (using an instruction token IDA-like highlighter), and a versatile JSON database suitable for comments, bookmarks, labels, etc.
In terms of what it can debug, x64dbg handles fully-featured debugging of DLL and EXE files. This is in thanks to TitanEngine, as well as to a built-in assembler (XEDParse) and the programme's ability to dynamically recognise modules and strings.
Robust support
Also, because of a dedicated modding community, x64dbg contains an extensive list of reports. Each update is listed alongside any changes, so you can see for yourself if a particular feature has been improved or modified.
If you do feel like taking a crack at changing the debugger for your own purposes, a dynamic stack view, fully customisable colour scheme and intuitive and familiar, yet new interface all mean you can personalise it easily.
Extensive customisation options
If you’re on the lookout for a substantial Windows debugger, thenx64dbg is an excellent, safe choice. You'll just want to remember that you need to know what you’re doing if you feel like taking a look under the hood.


