QChartist - Free Charting Software for Technical Analysis
Screenshots
QChartist is a free charting software designed for conducting technical analysis on various types of data, including Forex and Stocks. It is a powerful tool that allows users to analyze and interpret data in order to make informed decisions.
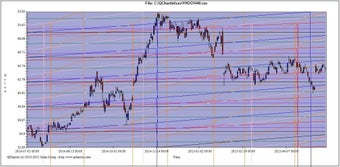
With QChartist, users can easily create charts and graphs to visualize trends, patterns, and indicators. The software provides a range of technical analysis tools, such as moving averages, trend lines, and oscillators, which can be customized and applied to different types of data. This enables users to identify potential trading opportunities and make predictions based on historical data.
One of the key advantages of QChartist is its user-friendly interface, which makes it easy for both beginners and experienced traders to navigate and use the software effectively. The program also offers a wide range of customization options, allowing users to personalize their charts and indicators to suit their individual preferences and trading strategies.
In summary, QChartist is a reliable and comprehensive charting software that provides users with the tools they need to conduct technical analysis and make informed trading decisions. Whether you are a beginner or an experienced trader, this free software can be a valuable asset in your trading toolkit.


